Daily Insights archive

Useful facts, preserved with their context.

Browse every HowToMoney Daily Insight in date order. Each entry is date-stamped, linked to its source and connected to a practical next step.

Back to Latest
Daily insight
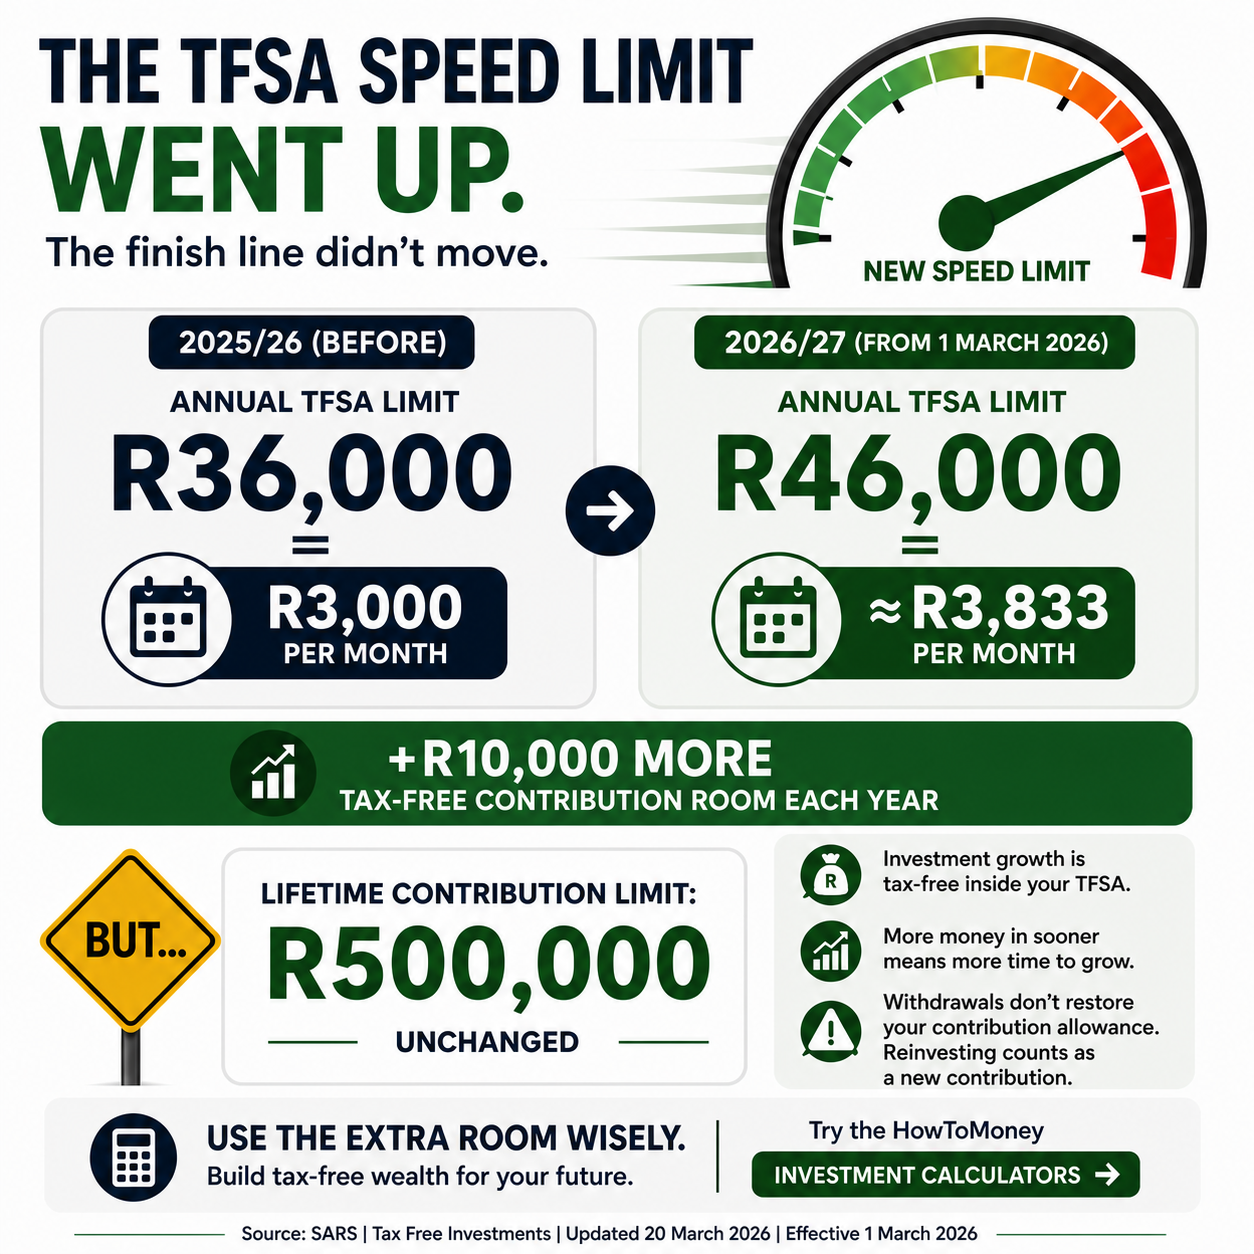
HowToMoney infographic showing the annual South African Tax-Free Investment contribution limit increasing from R36 000 to R46 000 while the R500 000 lifetime contribution limit remains unchanged
R46 000

The TFSA speed limit went up. The finish line did not move.

From 1 March 2026, South Africa's annual Tax-Free Investment contribution limit increased from R36 000 to R46 000. That is R10 000 more annual contribution room and an approximate monthly budgeting equivalent of R3 833 instead of R3 000.

The lifetime contribution limit remains R500 000. This is a limit on contributions, not the account value, so tax-free investment growth may take the balance above R500 000. The higher annual limit can move more money into the tax-free environment sooner, giving it potentially more time to compound. Withdrawals do not restore contribution room, and reinvesting a withdrawal generally counts as a new contribution.

R3 833 per month is an approximate budgeting equivalent of the R46 000 annual limit, not a separate monthly limit. The R500 000 lifetime limit applies to contributions, not investment growth. Limits apply in aggregate across all your tax-free investments. Unused annual contribution room does not carry forward, and excess contributions may attract tax of 40% of the excess. General financial education only. Individual circumstances differ.
Daily insight
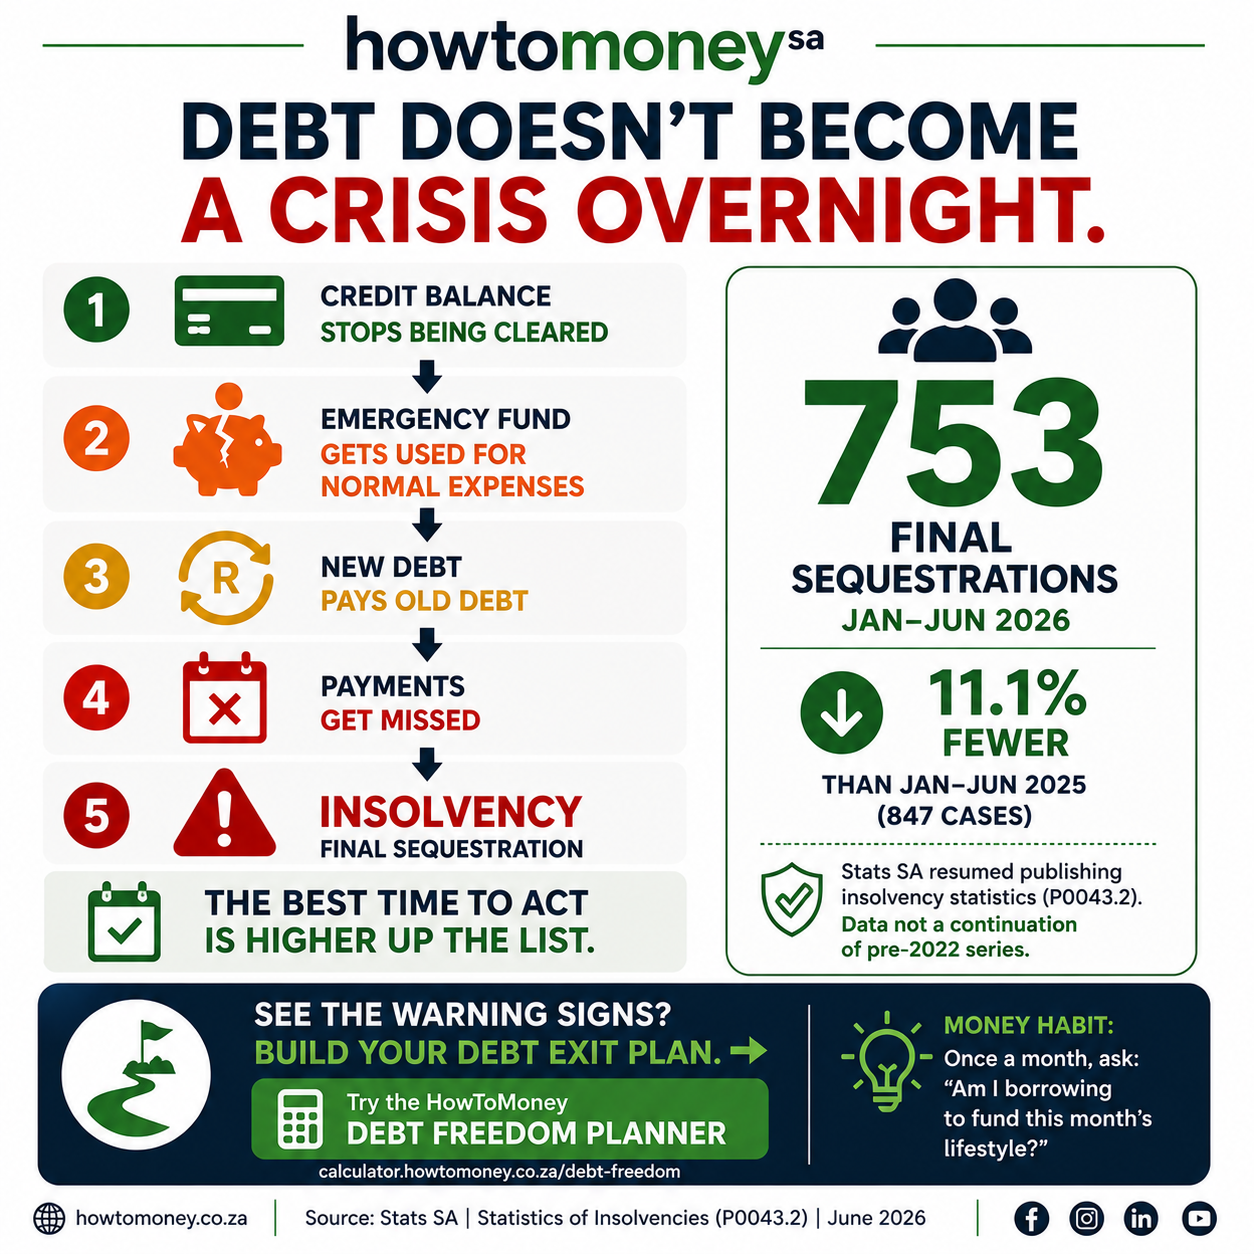
HowToMoney infographic showing five possible debt warning signs and Stats SA's 753 final sequestrations from January to June 2026
753

Debt does not become a crisis overnight.

Stats SA recorded 753 individuals and partnerships placed under final sequestration in South Africa from January to June 2026. This was 11.1% fewer than the 847 recorded over the same period in 2025.

Debt distress often shows warning signs much earlier. A revolving credit balance is no longer cleared, emergency savings repeatedly fund ordinary monthly expenses, new debt pays old debt, and payments begin to be missed. These stages are neither universal nor inevitable, but the best time to act is higher up the list. Ask yourself once a month: Am I borrowing to fund this month's lifestyle?

The stages shown are common warning signs, not an inevitable path. Using an emergency fund during a genuine emergency is its intended purpose; repeatedly using it for ordinary monthly spending is the warning sign described here. The statistics count individuals and partnerships placed under final sequestration. Stats SA resumed publishing this series in July 2026, and the data is not a continuation of the pre-2022 series. General financial education only. Individual circumstances differ.
Daily insight
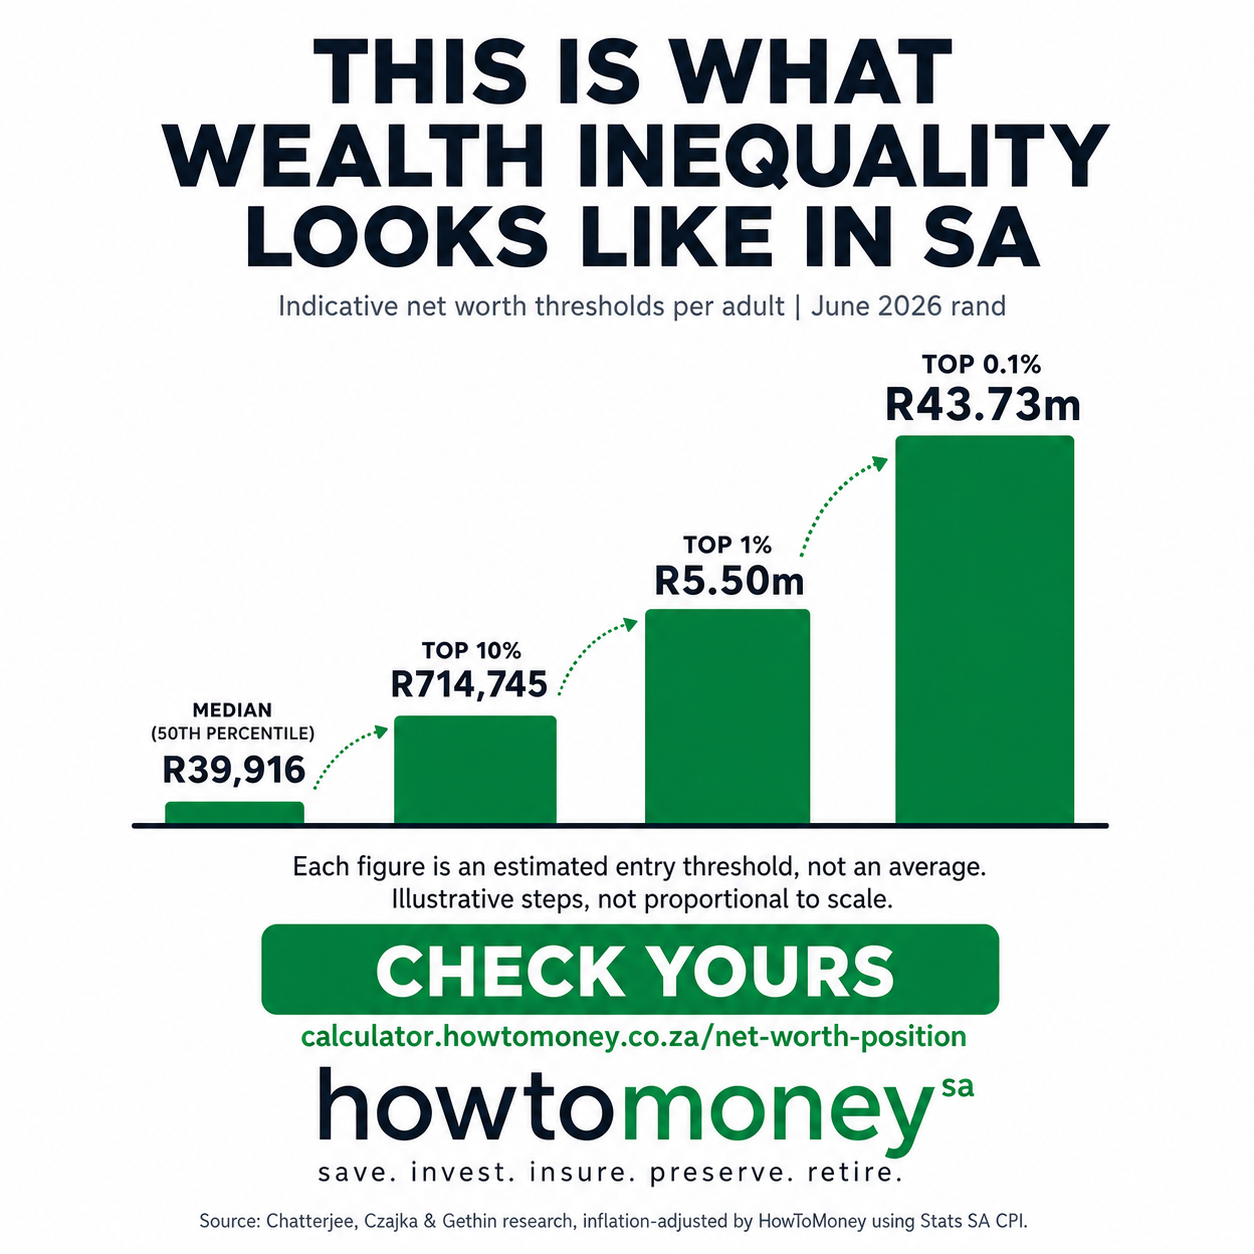
HowToMoney infographic showing indicative South African net worth entry thresholds from the median to the wealthiest 0.1%, expressed in June 2026 rand
R39 916

This is what wealth inequality looks like in South Africa.

Indicative entry thresholds per South African adult aged 20 or older, expressed in June 2026 rand, rise from an estimated median of R39 916 to R714 745 for entry to the wealthiest 10%, R5.50 million for entry to the wealthiest 1% and R43.73 million for entry to the wealthiest 0.1%. Each amount is an entry threshold, not the group's average wealth.

The jump is extraordinary. The wealthiest 10% are not one homogeneous group. World Inequality Report 2026 estimates for 2024 indicate that the wealthiest 10% hold 85.6% of total wealth, while the wealthiest 1% alone hold 54.7%. Most wealth is therefore concentrated much further up the curve.

Each amount is an indicative entry threshold, not the group's average wealth. The thresholds are based on a detailed 2017 South African wealth distribution reported in 2018 rand and inflation-adjusted to June 2026 using Stats SA CPI. This does not create a newly observed 2026 wealth distribution. The chart uses illustrative steps and is not proportionally scaled. General information only.

Daily insight
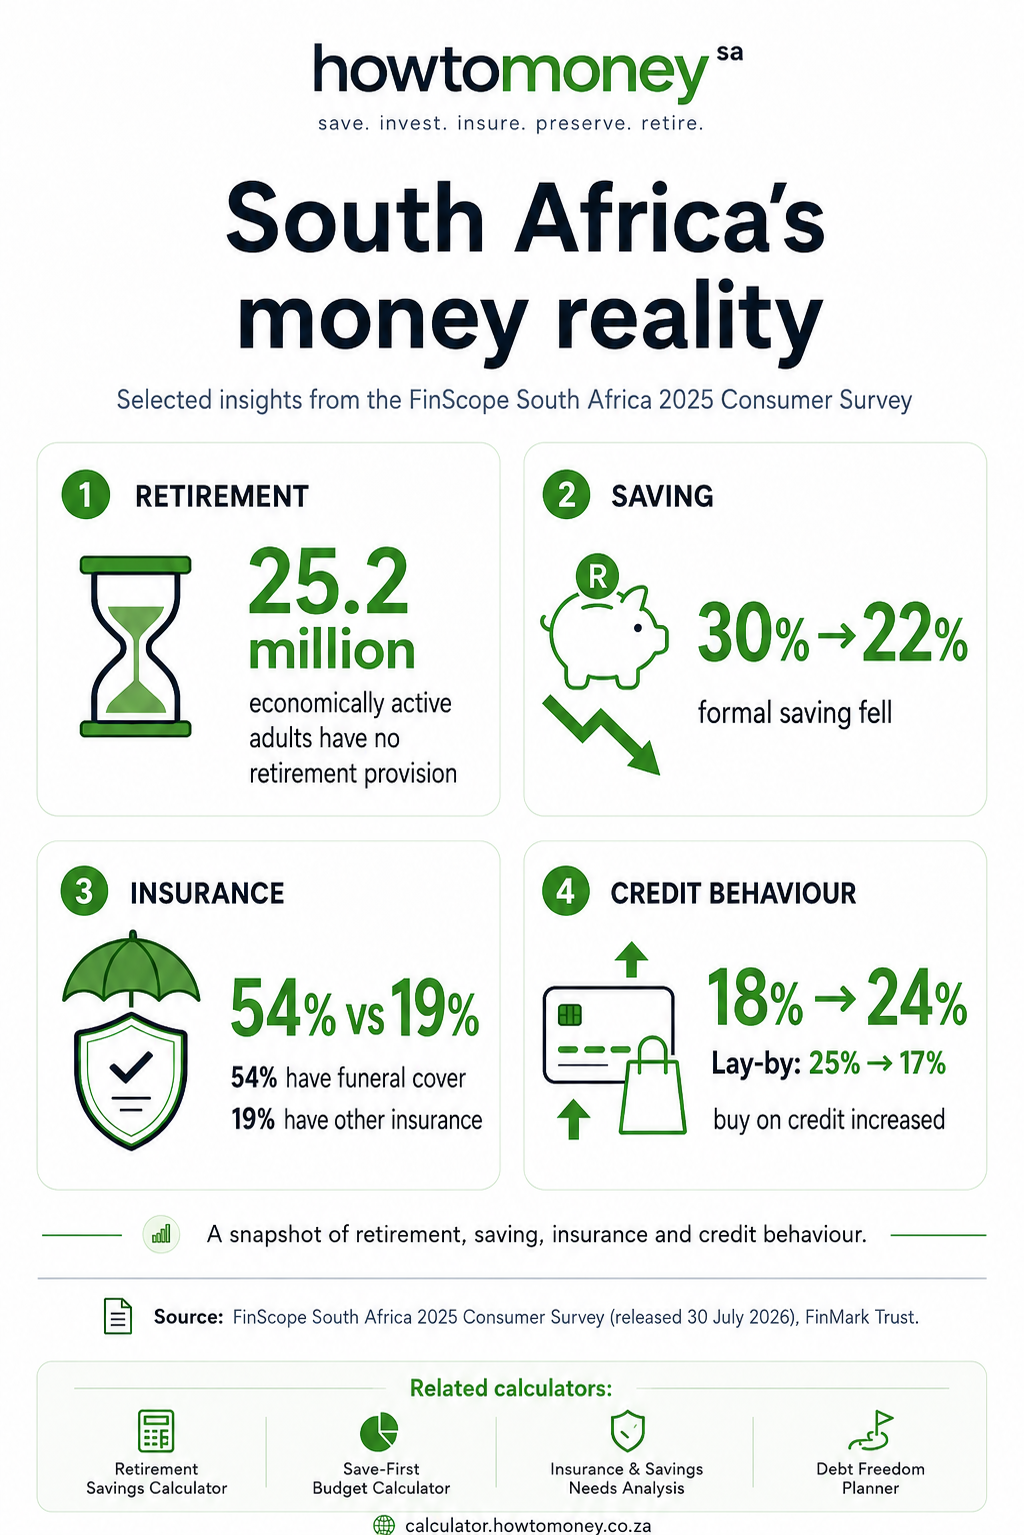
HowToMoney infographic summarising FinScope 2025 findings on retirement provision, formal saving, insurance and credit behaviour in South Africa
25.2m

South Africa's money reality.

The latest FinScope South Africa Consumer Survey provides a powerful snapshot of financial pressure. Approximately 25.2 million people, or 86% of economically active adults, have no retirement provision. Formal saving fell from 30% in 2024 to 22% in 2025.

Funeral cover reaches 54% of adults, but only 19% have any form of non-funeral insurance. Purchases of goods on credit rose from 18% to 24%, while lay-by use fell from 25% to 17%. A plan cannot remove every financial pressure, but it can help people understand the trade-offs, protect priorities and take the next affordable step.

Survey estimates are based on nationally representative interviews with 5,600 adults across all nine provinces. General information only. Individual circumstances differ.
Daily insight
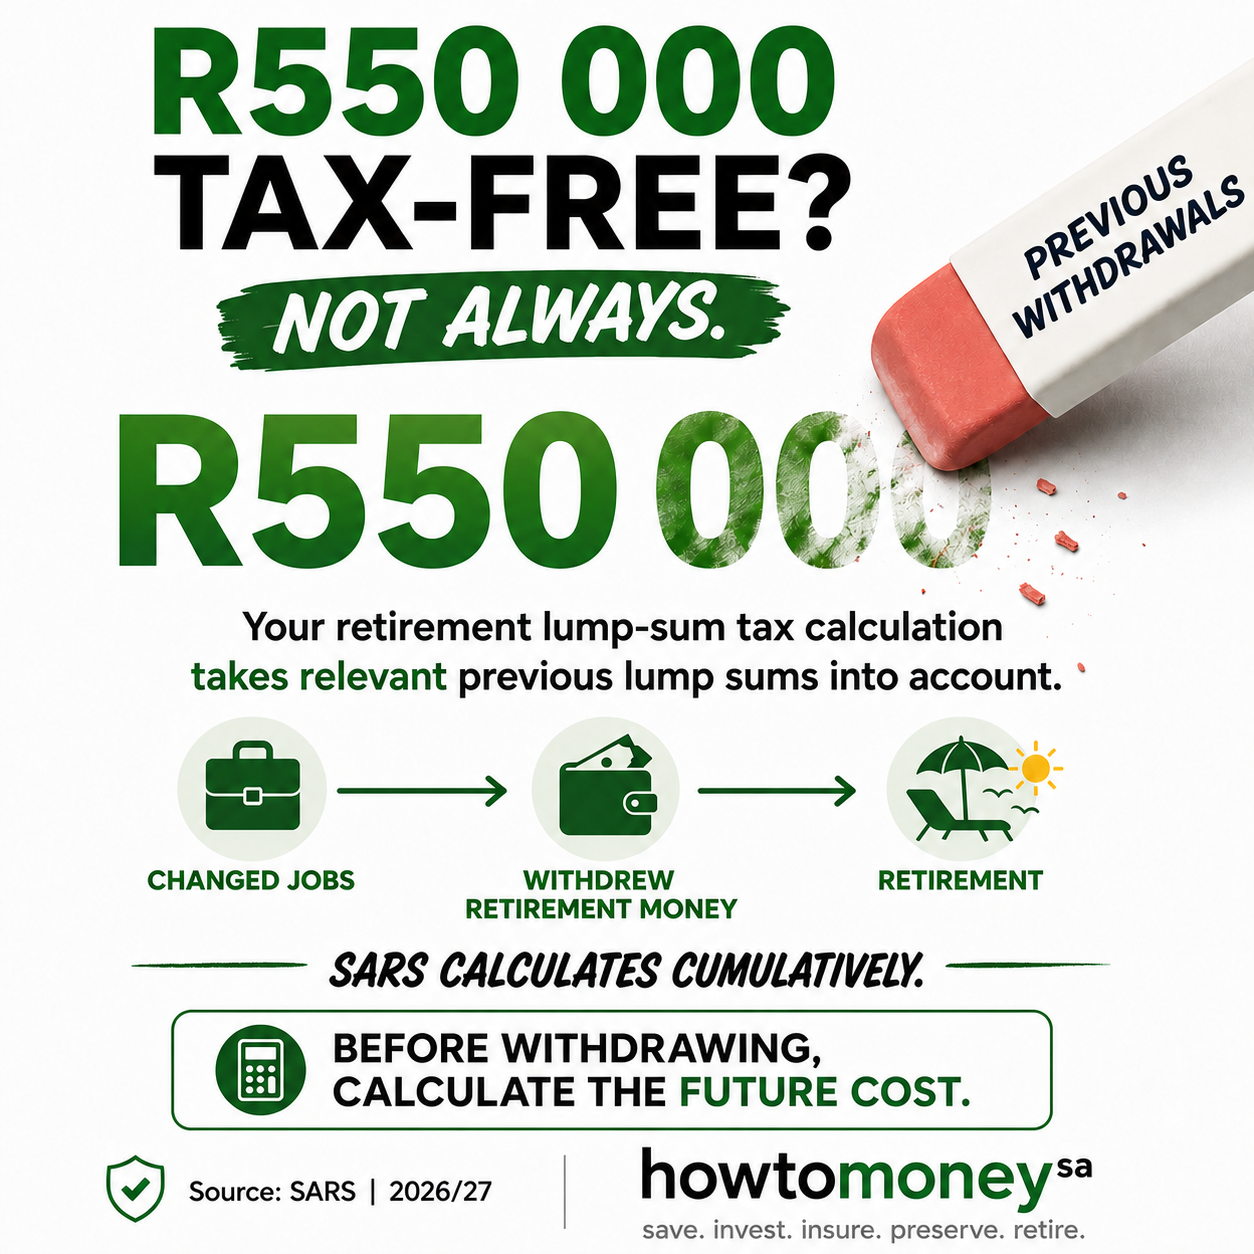
HowToMoney graphic explaining that the R550 000 retirement lump-sum tax band is cumulative and may be affected by relevant previous lump sums
R550 000

The R550 000 retirement tax misconception.

For the 2026/27 tax year, the first R550 000 of the cumulative taxable amount under the retirement lump-sum benefit table falls within the 0% tax band. But that does not mean everyone reaches retirement with a fresh R550 000 tax-free allowance.

SARS calculates retirement lump-sum tax cumulatively. Relevant previous retirement lump-sum benefits, retirement fund withdrawal benefits and severance benefits may affect the tax payable when another lump sum is received. An earlier cash-out can therefore cost both future investment growth and space in the lower lump-sum tax bands.

This does not refer to two-pot savings-component withdrawals, which are generally taxed at the person's marginal income-tax rate. General information only. Individual circumstances and tax treatment differ.

Daily insight
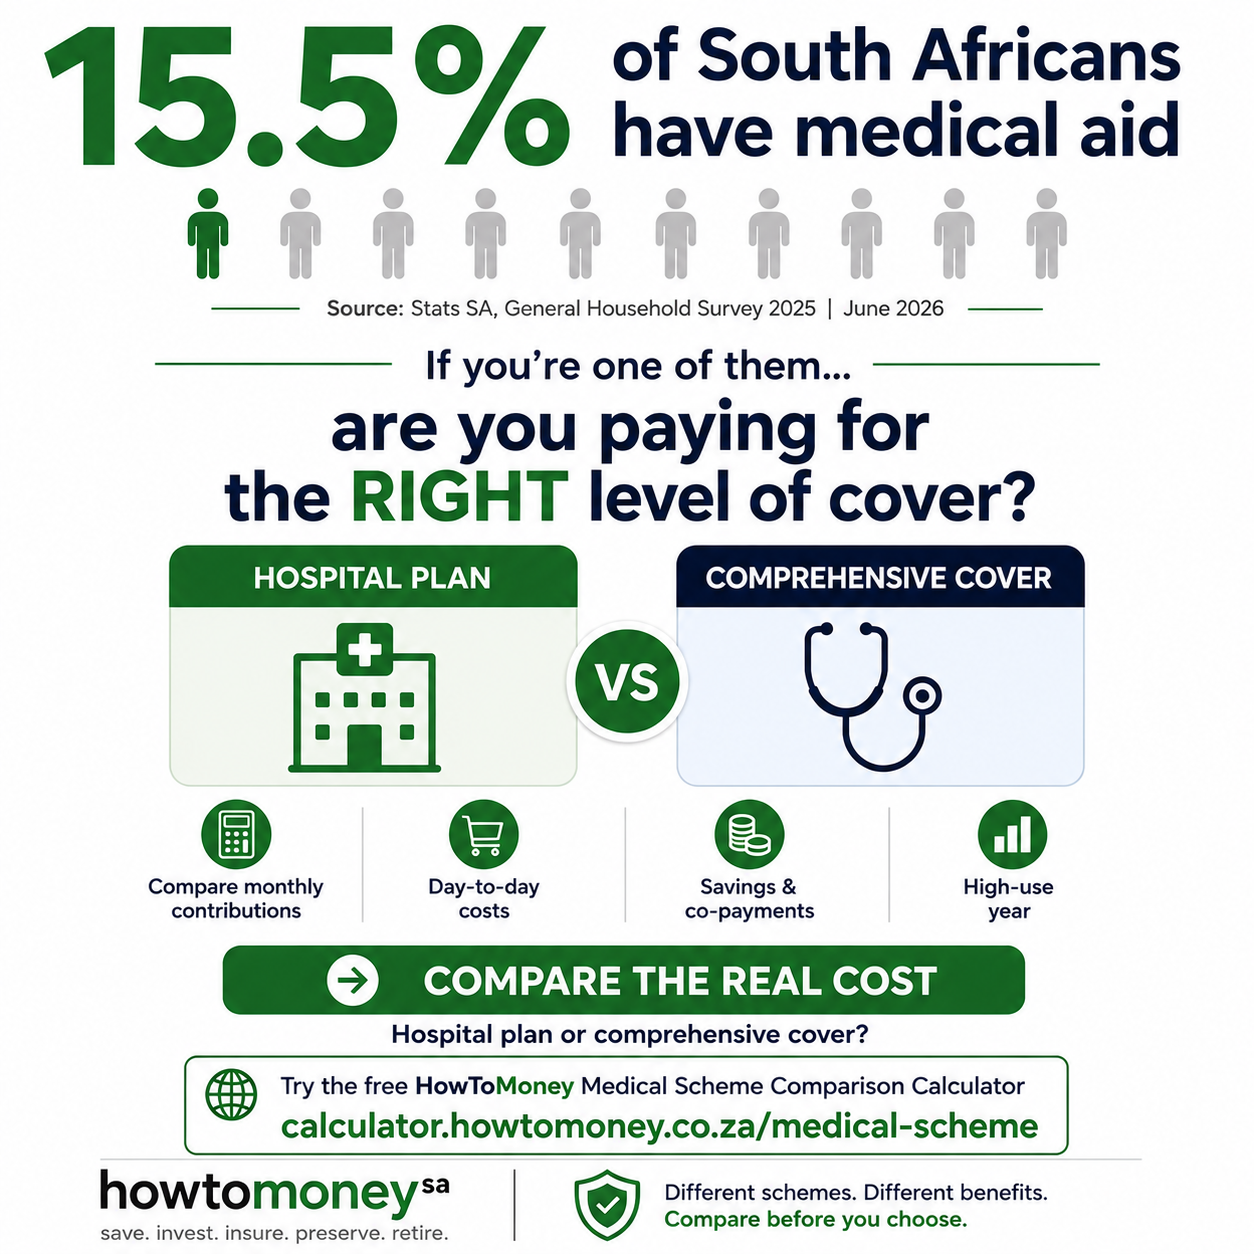
HowToMoney graphic showing that 15.5% of South Africans had medical aid in 2025 and inviting users to compare hospital and comprehensive cover
15.5%

Only 15.5% of individuals were covered by medical aid in 2025.

According to Stats SA's latest General Household Survey, 15.5% of individuals in South Africa were covered by a medical aid scheme in 2025.

For those who have medical aid, the next question is whether they are paying for the right level of cover. A cheaper monthly contribution does not necessarily mean a lower total healthcare cost. Day-to-day expenses, medical savings, co-payments and higher-use years all matter.

General information only. Medical scheme benefits, rules and individual needs differ.

Did you know?
85.6%

South African wealth is concentrated at the top.

The wealthiest 10% of South Africans held an estimated 85.6% of total net wealth in 2024. The wealthiest 1% held 54.7%, while the bottom 50% had a negative 2.5% share.

This helps explain why a relatively modest net worth may place someone higher in the national distribution than expected. The calculator therefore uses broad bands rather than claiming an exact percentile.

Use the information as a starting point

Daily Insights provide general information, not personal financial, tax, legal, medical-scheme or investment advice. Time-sensitive facts are date-stamped and linked to their stated sources.